Fig. 2
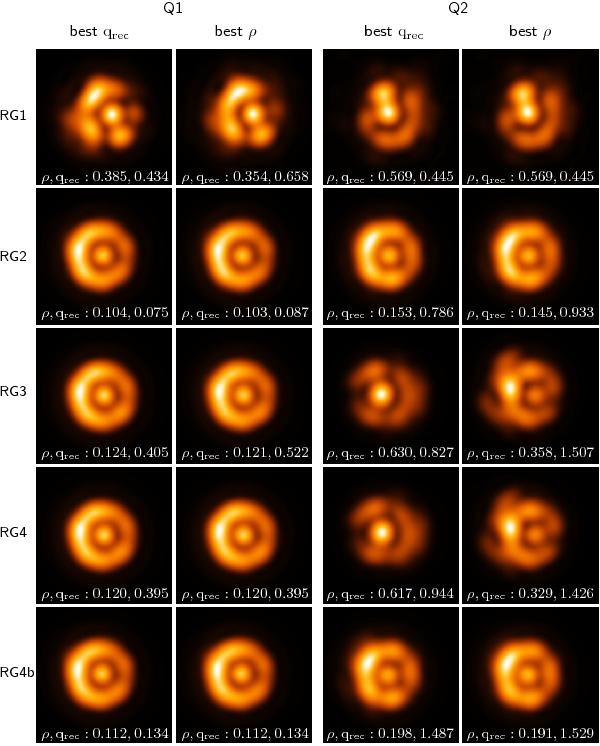
Dependence of the reconstructions on (a) the regularization functions H [ok(x)] used and (b) the χ2 function Q [ok(x)] applied in the cost function. This study shows reconstructions of the 16.8 mas disk-star target obtained in the experiment, as shown in Fig. 1 (for average S/N ~ 9 of the squared visibilities). Each row presents the reconstructions performed with one of the five regularization functions (RG1, RG2, RG3, RG4, and RG4b; see text and Eqs. (7)–(10)). The first two columns are reconstructions using the χ2 function Q1 [ok(x)] (see Eq. (4)) and the last two columns are reconstructions with the χ2 function Q2 [ok(x)] (see Eq. (5)). The columns labeled with “best qrec” are the reconstructions with the smallest value of qrec and those labeled with “best ρ” are the reconstructions with the smallest distance to the theoretical target. In each image, its restoration error ρ and its value of the reconstruction quality parameter qrec is presented.
Current usage metrics show cumulative count of Article Views (full-text article views including HTML views, PDF and ePub downloads, according to the available data) and Abstracts Views on Vision4Press platform.
Data correspond to usage on the plateform after 2015. The current usage metrics is available 48-96 hours after online publication and is updated daily on week days.
Initial download of the metrics may take a while.