Fig. 1
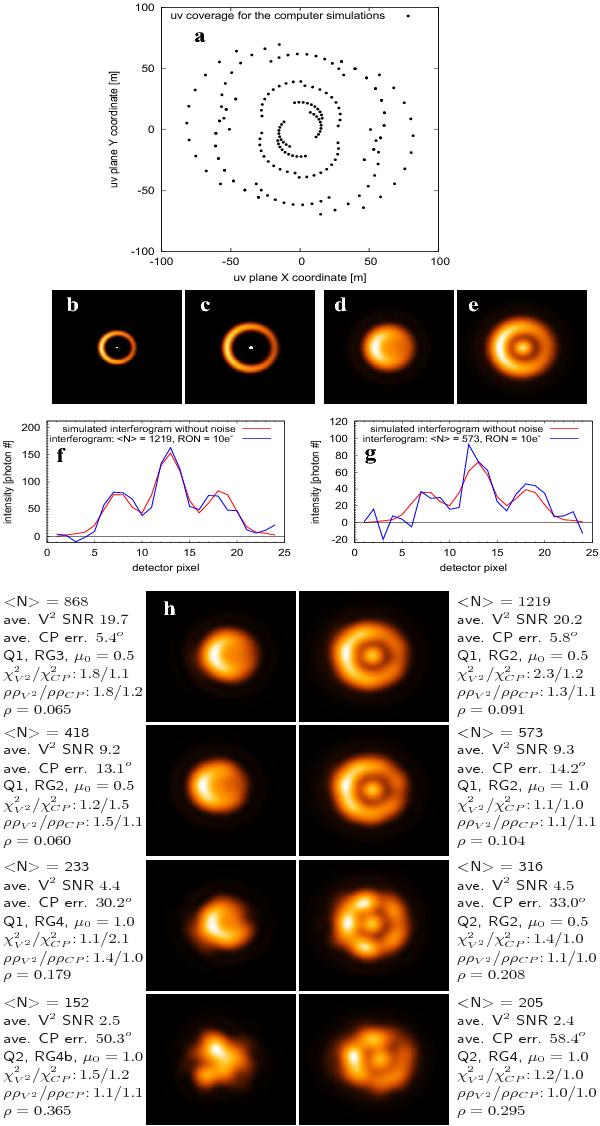
Computer simulation of aperture-synthesis imaging with the IRBis image reconstruction method: a) uv coverage (see Table 1); b), c) intensity distribution of the two different disk-star computer targets (diameter 11.2 and 16.8 mas) (central star is clippped for display); d), e) intensity distribution of the targets convolved with the point spread function (PSF) of the simulated interferometer; f), g) examples of simulated interferograms (total number of interferograms is 250 per uv point) with 1219 and 573 photons per interferogram and simulated additive detector read-out noise (RON) of 10 electrons (the average value of the RON is subtracted); h) reconstructed images of the two targets for 10 e− RON and different photon numbers ⟨ N ⟩ per interferogram (from 1219 to 152). For each reconstruction, the labels give the corresponding average photon number ⟨ N ⟩ per interferogram, V2 S/N, CP error, χ2 function (Q1, Q2), regularization function (RG1, RG2, RG3, RG4, RG4b), χ2, residual ratio ρρ, and the restoration error ρ (see text).
Current usage metrics show cumulative count of Article Views (full-text article views including HTML views, PDF and ePub downloads, according to the available data) and Abstracts Views on Vision4Press platform.
Data correspond to usage on the plateform after 2015. The current usage metrics is available 48-96 hours after online publication and is updated daily on week days.
Initial download of the metrics may take a while.