Fig. 7
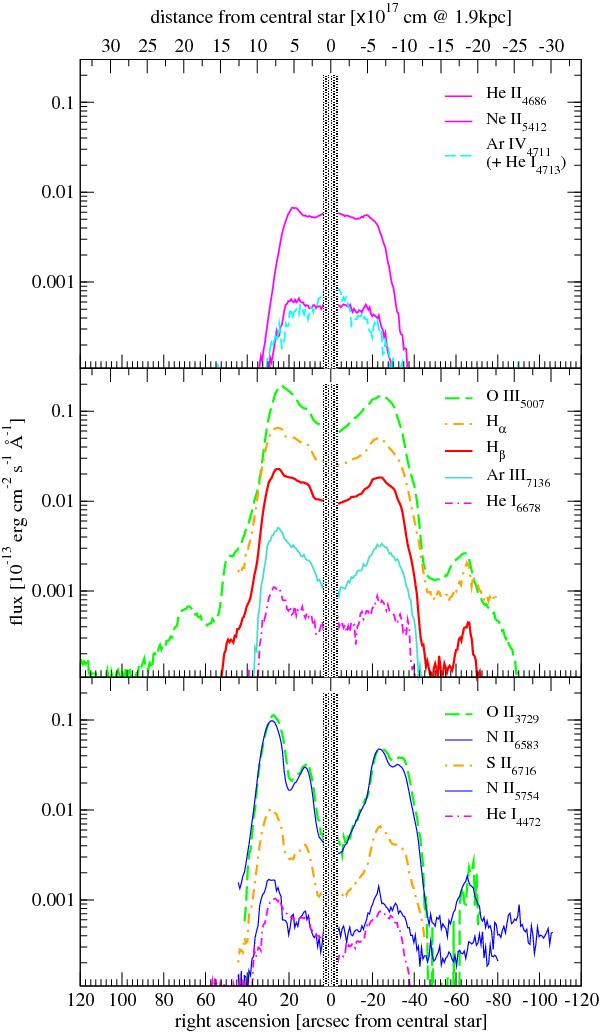
Various lines of the nebula (logarithmic representation). The different spectral regions originate from different spectra (ESO and SAAO) and thus vary in S/N ratio at similar physical intensities. The panels show the excitation groups (criteria see text). The high-excitation species (upper panel) concentrate at the central region. The medium-excitation species (middle panel) smoothly follow the total brightness and the radial behavior of the VLA image throughout the nebula. The low-excitation species (lower panel) are dominated by clumpy structures. The O ii λ3729 is at the edge of the CCD and its flux calibration is very uncertain. It is added only for comparison of the profiles.
Current usage metrics show cumulative count of Article Views (full-text article views including HTML views, PDF and ePub downloads, according to the available data) and Abstracts Views on Vision4Press platform.
Data correspond to usage on the plateform after 2015. The current usage metrics is available 48-96 hours after online publication and is updated daily on week days.
Initial download of the metrics may take a while.