Fig. 14
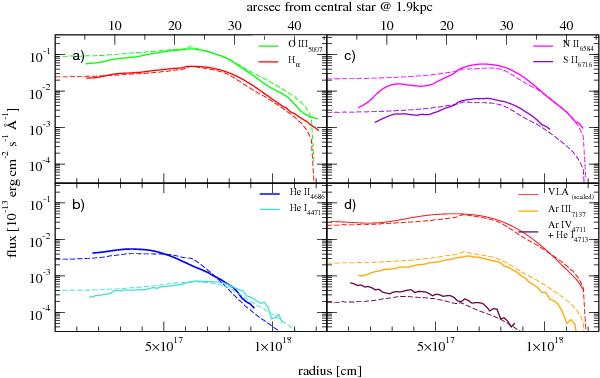
Complete CLOUDY model of the main nebula. The dashed lines give the observational data, while the full lines depict the model. The spectral lines in the left panels a) and b) are used to fit the free parameters of the density law, the filling factor, and the temperature of the CSPN. The right panels c) and d) give the results derived for other lines from the best-fit model. The VLA intensities were arbitrarily scaled to the same level as the peak in Hα.
Current usage metrics show cumulative count of Article Views (full-text article views including HTML views, PDF and ePub downloads, according to the available data) and Abstracts Views on Vision4Press platform.
Data correspond to usage on the plateform after 2015. The current usage metrics is available 48-96 hours after online publication and is updated daily on week days.
Initial download of the metrics may take a while.