Fig. 13
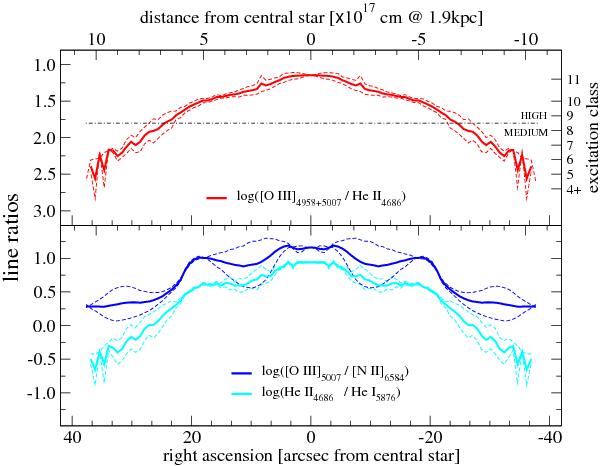
Excitation- and ionization-sensitive line ratios. The dashed lines are the spectra along the slits through the center in original orientation (E-W) and the same spectrum reversed in direction to show the asymmetries. The thick lines are the average of both directions. The excitation class and level of separation of medium to high excitation is used according to the calibration by Reid & Parker (2010).
Current usage metrics show cumulative count of Article Views (full-text article views including HTML views, PDF and ePub downloads, according to the available data) and Abstracts Views on Vision4Press platform.
Data correspond to usage on the plateform after 2015. The current usage metrics is available 48-96 hours after online publication and is updated daily on week days.
Initial download of the metrics may take a while.