Fig. 10
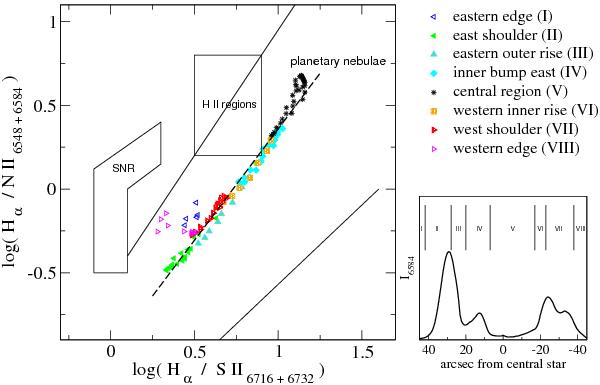
Diagnostic diagram of the separation of shocked nebulae from photoionized PNe (after Magrini et al. 2003). The points follow the sequence of the ionization class toward the center. The dashed line gives a fit through the good data points (filled symbols). No dependency on increase or decrease of the intensity can be found (small panel).
Current usage metrics show cumulative count of Article Views (full-text article views including HTML views, PDF and ePub downloads, according to the available data) and Abstracts Views on Vision4Press platform.
Data correspond to usage on the plateform after 2015. The current usage metrics is available 48-96 hours after online publication and is updated daily on week days.
Initial download of the metrics may take a while.