Free Access
Fig. 3
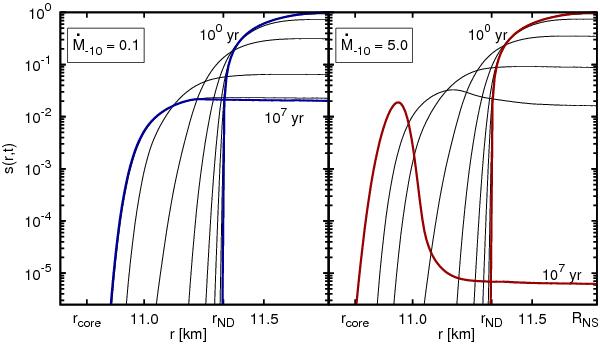
Evolution of the Stokes function at the crust of the LM model. Each panel corresponds to a different accretion rate. In both panels, each curve (from top to bottom at the NS surface RNS) corresponds to t = 1, 101, 102, 103, 104, 105, 106, and 107 yr. In all cases, we use Q = 5 and no SF model.
Current usage metrics show cumulative count of Article Views (full-text article views including HTML views, PDF and ePub downloads, according to the available data) and Abstracts Views on Vision4Press platform.
Data correspond to usage on the plateform after 2015. The current usage metrics is available 48-96 hours after online publication and is updated daily on week days.
Initial download of the metrics may take a while.