Fig. 8
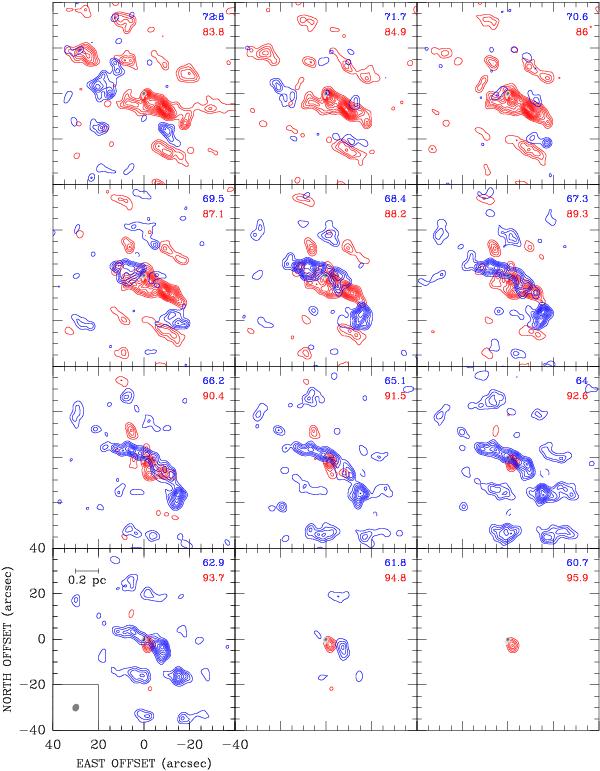
Channel maps of the 12CO (2–1) line emission observed with the compact configuration of the SMA. Each box contains pairs of maps corresponding to the blue- and red-shifted emission at the same velocity offset from Vsys. The corresponding LSR velocities (km s-1) are indicated in the top right corner of each box. Contours start from a 3σ level of 0.4 Jy beam-1 for both wings and increase in steps of 2σ. In the bottom left panel, a linear scale and the synthesized beam are shown. The map of the 1.3 mm dust continuum (gray contours) is shown in overlay.
Current usage metrics show cumulative count of Article Views (full-text article views including HTML views, PDF and ePub downloads, according to the available data) and Abstracts Views on Vision4Press platform.
Data correspond to usage on the plateform after 2015. The current usage metrics is available 48-96 hours after online publication and is updated daily on week days.
Initial download of the metrics may take a while.