Fig. 7
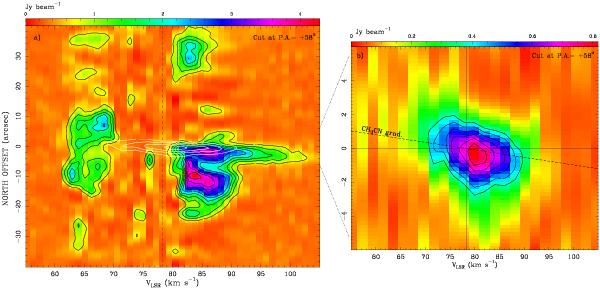
p − v plot of the outflow tracers 12CO (2–1) and SiO (5–4), along a cut with PA = +58° (cf. Fig. 5a and d). The vertical line marks the Vsys. a) The 12CO emission is drawn with colors (color scale on top) and black contours, from 10% of the peak emission increasing by steps of 10%. A map of the SiO emission is overlaid in white contours starting from 30% of the peak emission and increasing by 20% steps. b) Close-up view of the SiO p − v plot within 6′′ from the HMC. The SiO emission is drawn with colors (color scale on top) and black contours, from 40% of the peak emission increasing by steps of 10%. The dashed line denotes the velocity trend obtained from the CH3CN emission (Fig. 3c).
Current usage metrics show cumulative count of Article Views (full-text article views including HTML views, PDF and ePub downloads, according to the available data) and Abstracts Views on Vision4Press platform.
Data correspond to usage on the plateform after 2015. The current usage metrics is available 48-96 hours after online publication and is updated daily on week days.
Initial download of the metrics may take a while.