Free Access
Fig. 6
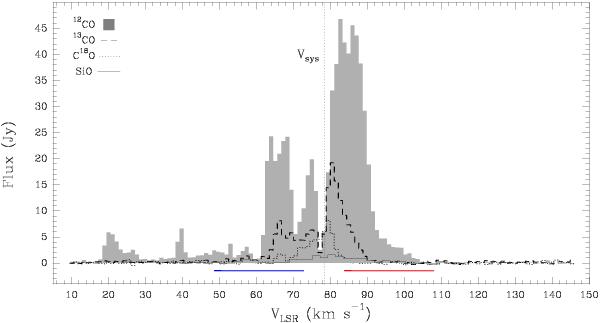
Spectra of the outflow tracers, 12CO (2–1), 13CO (2–1), C18O (2–1), and SiO (5–4) obtained by averaging the emission inside the dashed box in Fig. 5a. The ranges of integration used for the CO lines are marked along the x-axis (blue and red lines); the rest velocity of the CH3CN (12–11) lines is also shown (Vsys).
Current usage metrics show cumulative count of Article Views (full-text article views including HTML views, PDF and ePub downloads, according to the available data) and Abstracts Views on Vision4Press platform.
Data correspond to usage on the plateform after 2015. The current usage metrics is available 48-96 hours after online publication and is updated daily on week days.
Initial download of the metrics may take a while.