Fig. 5
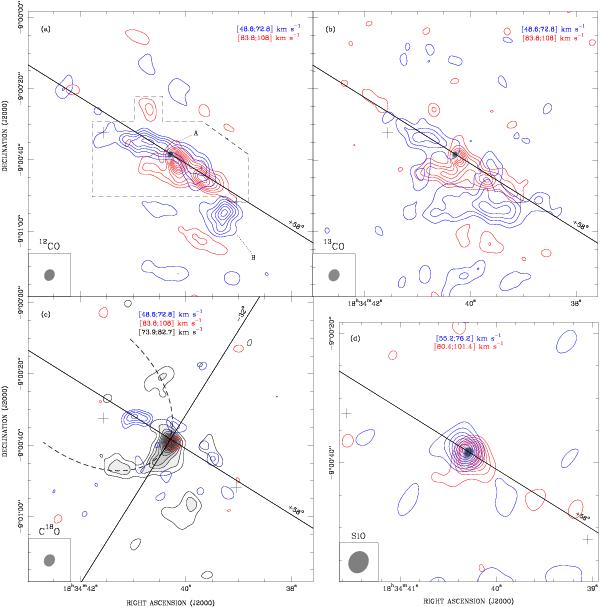
SMA maps of the outflow emission from G023.01−00.41. a) Integrated emission of the 12CO (2–1) line within the velocity ranges indicated in the top right corner. The blue and red velocities are symmetric with respect to the Vsys of the HMC. Contours start at 3σ and increase in steps of 2σ (corresponding to 3.8 and 2.6 Jy beam-1 km s-1, for the red- and blueshifted wings, respectively). At the center of the field is the 1.3 mm continuum map (grayscale). The NE–SW line draws the direction of the outflow inferred from the analysis of the HMC tracers (at + 58°). Labels A and B indicate, respectively, the HMC and another CO clump probably lying along the line of sight (see Sect. 4.2). The two plus signs mark the reference points for the computation of the outflow length (details in Sect. 3.2). The dashed pattern outlines the region over which emission was averaged to obtain the spectra in Fig. 6. The SMA synthesized beam is shown in the lower left corner. b) Same as panel a), for the 13CO (2–1) line emission. Contours start at 3σ and increase in steps of 2σ (corresponding to 0.61 and 0.82 Jy beam-1 km s-1, for the red- and blueshifted emission, respectively). c) Same as panel a), for the C18O (2–1) line emission. The gray contours are a map of the C18O bulk emission integrated over the FWHM of the CH3CN lines. The NW–SE line indicates the direction of the major axis of the HMC and the dashed pattern marks the putative border of the NE outflow lobe, partially traced by the C18O bulk emission. Contours start at 3σ and increase in steps of 2σ (0.59 Jy beam-1 km s-1) for the bulk emission, and of 1σ for the redshifted (0.28 Jy beam-1 km s-1) and blueshifted (0.33 Jy beam-1 km s-1) emission. d) Similar to panel a) but for the SiO (5–4) line emission and with a zoom of two times the field of view. Contours start at 3σ and increase in steps of 2σ (0.64 and 0.54 Jy beam-1 km s-1 for the red- and blueshifted emission, respectively).
Current usage metrics show cumulative count of Article Views (full-text article views including HTML views, PDF and ePub downloads, according to the available data) and Abstracts Views on Vision4Press platform.
Data correspond to usage on the plateform after 2015. The current usage metrics is available 48-96 hours after online publication and is updated daily on week days.
Initial download of the metrics may take a while.