Free Access
Fig. 4
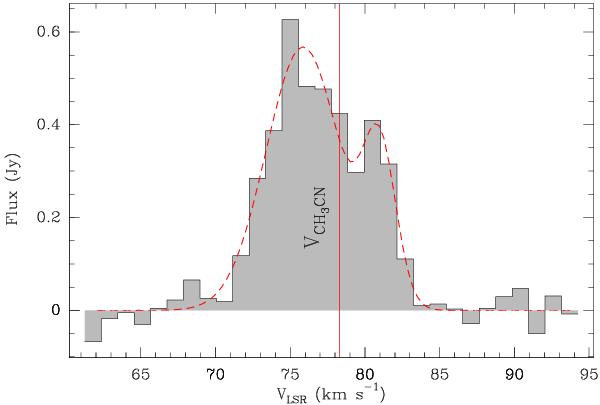
Spectrum of the CH3OH (154 − 163)E line emission presented in Fig. 1d. The dashed red line in the spectrum draws a double Gaussian fitting to the blue- and redshifted wings of the CH3OH profile, symmetric with respect to the systemic velocity of the CH3CN lines (vertical red line).
Current usage metrics show cumulative count of Article Views (full-text article views including HTML views, PDF and ePub downloads, according to the available data) and Abstracts Views on Vision4Press platform.
Data correspond to usage on the plateform after 2015. The current usage metrics is available 48-96 hours after online publication and is updated daily on week days.
Initial download of the metrics may take a while.