Fig. 3
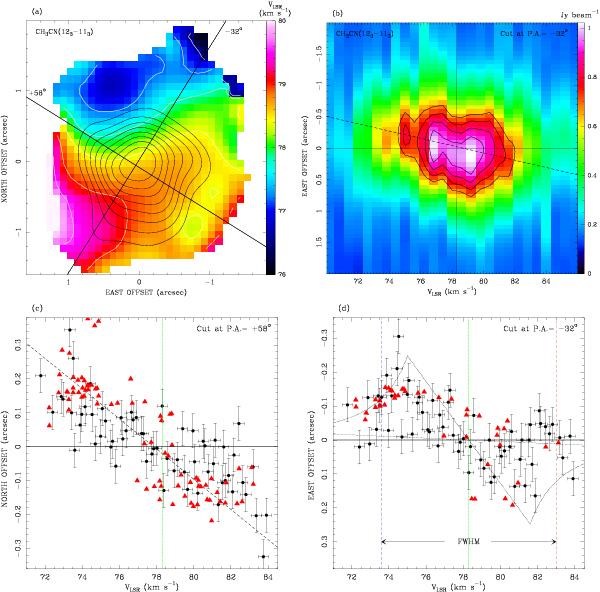
Velocity pattern of the inner core from the CH3CN (12–11) lines. In all panels the vertical and horizontal lines mark, respectively, the systemic velocity of the core and the position of the dust continuum peak. a) Map of the CH3CN (123 − 113) line velocity (color scale). Offsets are measured with respect to the phase center. Superimposed are the contours of the bulk emission from Fig. 1b (black) and the directions (straight lines), passing through the continuum peak, along which the p − v cuts presented in the following panels have been computed. b) p − v cut of the CH3CN (123 − 113) line along the major axis of the elongated HMC (−32°); east offsets are measured along this cut. Contours start at 60% of the peak emission and increase by 10% steps; colors are drawn according to the wedge on the right side. The dashed line represents the linear fit performed in panel d) within the FWHM of the CH3CN (12K − 11K) lines. c) p − v distribution of the peaks of the CH3CN emission (black dots) at different velocities (only the K = 0 to 4 components have been used) along the outflow direction (+ 58°); north offsets are measured along this cut. Error bars indicate the spectral resolution of the CH3CN (12–11) observations and the uncertainty of the Gaussian fits in the maps. The dashed black line is the best linear fit to the peak distribution, which has a slope dv/dx = −22.4 ± 2.4 km s-1 arcsec-1, and a correlation coefficient of r = 0.8. The red triangles represent the CH3OH maser spots detected by Sanna et al. (2010). d) Same as panel c) for the cut along the major axis of the elongated HMC (PA = −32°); east offsets are measured along this cut. The vertical dashed lines mark the limits of the FWHM of the CH3CN (12–11) lines. The best linear fit (not shown in this figure) to the points within the line FWHM is obtained for dv/dx = −17.2 ± 3.3 km s-1 arcsec-1, with r = 0.6. The dotted pattern encompasses the region where emission is expected from a Keplerian disk rotating about a 19 M⊙ star. Here, the red triangles mark only the CH3OH maser spots with a distance of less than 0.25 arcsec from the dust continuum peak.
Current usage metrics show cumulative count of Article Views (full-text article views including HTML views, PDF and ePub downloads, according to the available data) and Abstracts Views on Vision4Press platform.
Data correspond to usage on the plateform after 2015. The current usage metrics is available 48-96 hours after online publication and is updated daily on week days.
Initial download of the metrics may take a while.