Fig. 2
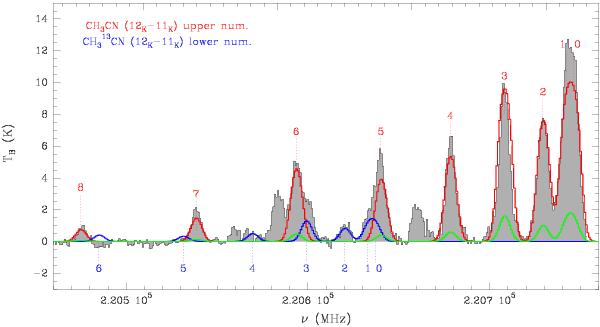
Spectra of the CH3CN (12K–11K) lines computed within the 5σ contours of the dust continuum map (see Sect. 3.1) up to the higher component detectable (K = 8). The gray profile shows the integrated spectrum and compares the measured profile and the XCLASS synthetic spectra obtained in LTE approximation for: 1) the CH3CN K-ladder (red); 2) the CH CN K-ladder (blue); 3) and the opacity profile (green; same scale as the intensity one). The position of the K-ladders for the CH3CN and its isotopomer is marked. Details in Sect. 3.1 and Table 4.
Current usage metrics show cumulative count of Article Views (full-text article views including HTML views, PDF and ePub downloads, according to the available data) and Abstracts Views on Vision4Press platform.
Data correspond to usage on the plateform after 2015. The current usage metrics is available 48-96 hours after online publication and is updated daily on week days.
Initial download of the metrics may take a while.