Fig. 11
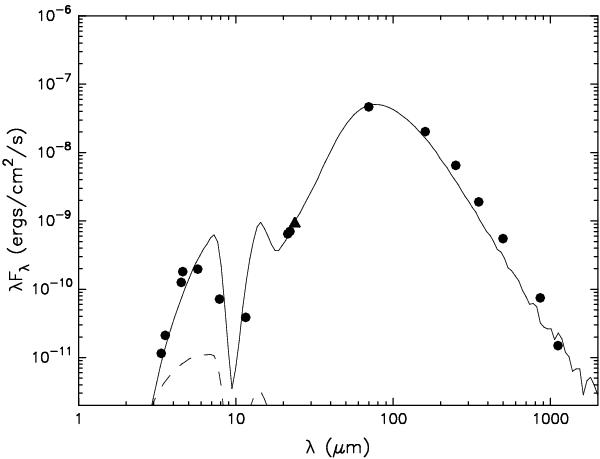
Spectral energy distribution of G023.01−00.41 from 3.4 μm to 1.1 mm. Dots (triangle) indicate measurements (lower limit) from different telescopes (see Table 6). The SED was fitted with the radiative transfer model developed by Robitaille et al. (2007, and available as a fitting tool at http://caravan.astro.wisc.edu/protostars/. The solid black line indicates the best-fitting model.
Current usage metrics show cumulative count of Article Views (full-text article views including HTML views, PDF and ePub downloads, according to the available data) and Abstracts Views on Vision4Press platform.
Data correspond to usage on the plateform after 2015. The current usage metrics is available 48-96 hours after online publication and is updated daily on week days.
Initial download of the metrics may take a while.