Fig. 10
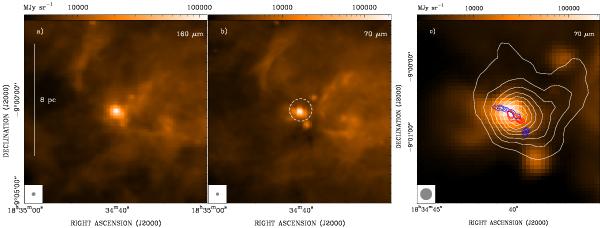
Parsec-scale structure of the G023.01−00.41 star forming region obtained at 160 μm and 70 μm (color log-scale on top of each panel), and at 870 μm (gray contours, panel c)). All plots are centered on the HMC, as done in Figs. 1 and 5. a) Herschel view of the region at 160 μm within ±4.9′ from the HMC. The linear scale is drawn on the left side of the plot. b) Similar to a) but for the 70 μm continuum emission. The dashed white circle marks the region inside which the fluxes in Table 6 have been measured. c) Similar to panel b) but showing a close-up view of the region around the HMC. The white contours are the ATLASGAL map at 870 μm starting from 20% of the peak emission and increasing by steps of 10%. Superimposed are also the contours of the 12CO (2–1) outflow emission of Fig. 5a starting from a 7σ level (blue and red contours). For each plot, the beam size of the Herschel images is shown in the bottom left corner.
Current usage metrics show cumulative count of Article Views (full-text article views including HTML views, PDF and ePub downloads, according to the available data) and Abstracts Views on Vision4Press platform.
Data correspond to usage on the plateform after 2015. The current usage metrics is available 48-96 hours after online publication and is updated daily on week days.
Initial download of the metrics may take a while.