Fig. 1
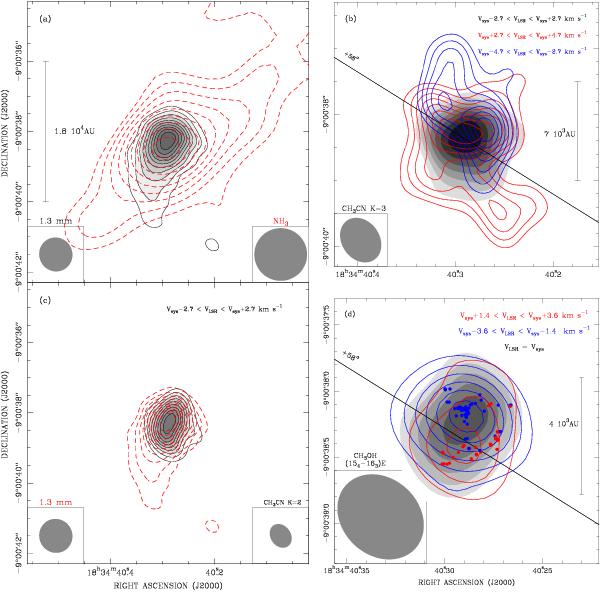
Images of the hot molecular core. a) SMA map of the 1.3 mm continuum emission from the combination of the compact and VEX configurations (grayscale), superimposed on the VLA–C NH3 (3, 3) map obtained by Codella et al. (1997, dashed red contours). Contour levels start from 5σ by 3σ for the 1.3 mm map (details on Table 3) and from 3σ in steps of 1σ (4 mJy beam-1) for the NH3 (3,3) map. The SMA and VLA–C synthesized beams are shown in the lower left and right corners, respectively. The linear scale is shown for comparison with panels b) and d) as well. b) Maps of the CH3CN (123–113) line integrated over its FWHM in three velocity ranges reported on top of the panel (Vsys = 78.3 km s-1; see Sect. 3.1). Contours start at 3σ and increase in steps of 1σ. The SMA synthesized beam is shown in the lower left corner (Table 3). The NE–SW line shows the outflow direction as described in Sect. 4.2. The f.o.v. is two times smaller than in panel a). c) Similar to panel a) with superimposed a map of the CH3CN (122–112) line (gray contours) integrated over the same bulk emission as panel b). The K = 2 line contours start at 3σ and increase in steps of 1σ. The SMA synthesized beam is shown in the lower right corner (Table 3). d) Maps of the CH3OH (154 − 163)E line emission, the strongest observed in the VEX configuration. Gray, blue, and red contours are, respectively, maps of emission at the systemic velocity, and in the blue- and redshifted wings of the line (the velocity ranges are indicated in the upper right corner). Gray contours start at 3σ and increase in steps of 1σ, whereas the blue and red contours start at a 5σ level in steps of 2σ. The SMA synthesized beam is shown in the lower left corner (Table 3). Blue and red dots mark the positions of the blue- and redshifted methanol maser spots detected by Sanna et al. (2010). The NE–SW line is the same as in panel b). The f.o.v. is four times smaller than in panel a).
Current usage metrics show cumulative count of Article Views (full-text article views including HTML views, PDF and ePub downloads, according to the available data) and Abstracts Views on Vision4Press platform.
Data correspond to usage on the plateform after 2015. The current usage metrics is available 48-96 hours after online publication and is updated daily on week days.
Initial download of the metrics may take a while.