Free Access
Fig. 6
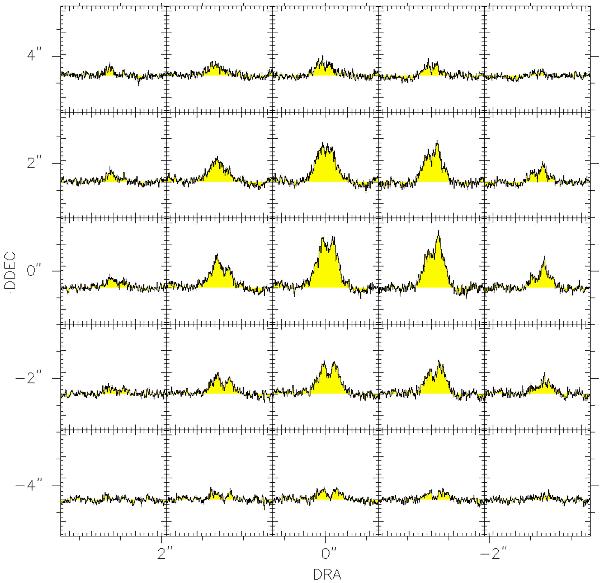
CO(1–0) line profile changes within few arcseconds (i.e., at sub-beam scales) from the position of the radio core in the PdB data. All spectra are plotted in the −1200 km s-1 to 1200 km s-1 velocity range.
Current usage metrics show cumulative count of Article Views (full-text article views including HTML views, PDF and ePub downloads, according to the available data) and Abstracts Views on Vision4Press platform.
Data correspond to usage on the plateform after 2015. The current usage metrics is available 48-96 hours after online publication and is updated daily on week days.
Initial download of the metrics may take a while.