Free Access
Fig. 5
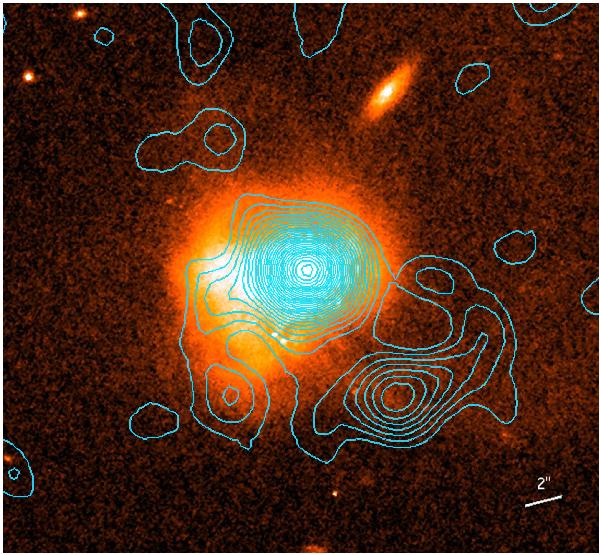
Contours of the CO(1–0) emission of 4C12.50, integrated from 25 km s-1 to 35 km s-1 and plotted over an 7300 Å Hubble Space Telescope ACS image (Batcheldor et al. 2007). The contours start at the 1σ level of the collapsed CO(1–0) image, 0.014 Jy/beam. They are spaced by an equal amount.
Current usage metrics show cumulative count of Article Views (full-text article views including HTML views, PDF and ePub downloads, according to the available data) and Abstracts Views on Vision4Press platform.
Data correspond to usage on the plateform after 2015. The current usage metrics is available 48-96 hours after online publication and is updated daily on week days.
Initial download of the metrics may take a while.