Fig. 3
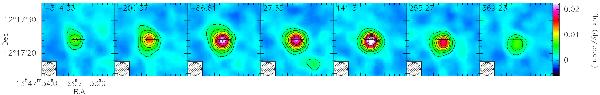
Continuum-free CO(1–0) line intensity map of 4C12.50, displayed for ~114 km s-1 bins (in the range −315 km s-1 to 369 km s-1). The number in the upperleft corner of each frame corresponds to the bin mean velocity. Contours are plotted at integer multiples of the 5σ level for these images, i.e., in steps of 2.4 mJy/beam. A shift toward the west of the line peak position from negative to positive velocities, as well as a distinct kinematic component near rest-frame velocity are observed.
Current usage metrics show cumulative count of Article Views (full-text article views including HTML views, PDF and ePub downloads, according to the available data) and Abstracts Views on Vision4Press platform.
Data correspond to usage on the plateform after 2015. The current usage metrics is available 48-96 hours after online publication and is updated daily on week days.
Initial download of the metrics may take a while.