Free Access
Fig. 2
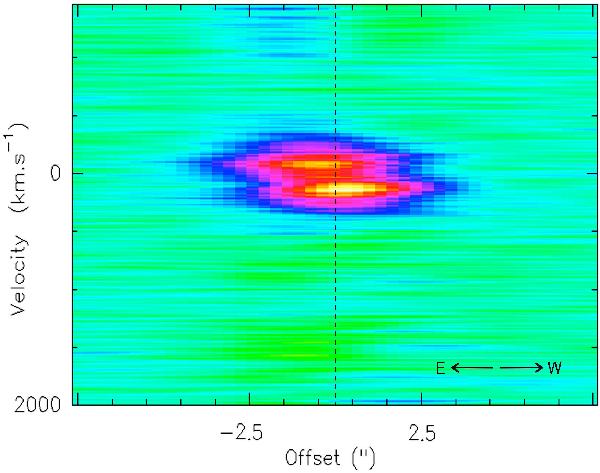
Position-velocity diagram of the continuum-free CO(1–0) emission along the east-west axis, displayed for a velocity resolution of 6 km s-1. The x-axis offset is computed from the radio core location, which is marked with a dashed line. The offset increases (/decreases) toward the west (/east).
Current usage metrics show cumulative count of Article Views (full-text article views including HTML views, PDF and ePub downloads, according to the available data) and Abstracts Views on Vision4Press platform.
Data correspond to usage on the plateform after 2015. The current usage metrics is available 48-96 hours after online publication and is updated daily on week days.
Initial download of the metrics may take a while.