Fig. 13
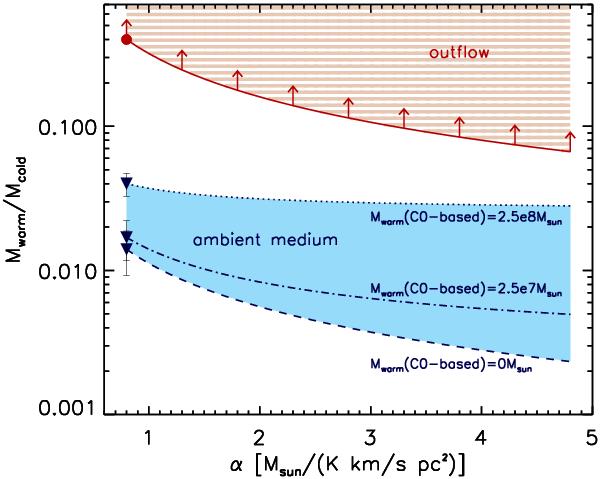
Warm-to-cold gas mass ratio as a function of the α conversion factor. The circle shows the ratio’s lower limit in the outflow for α = 0.8 M⊙/(K km s-1 pc2). The solid line shows how this lower limit decreases as α approaches values thought appropriate for the Milky Way. This curve brackets the range of all acceptable Mwarm/Mcold values in the outflow (hatched area), under the assumption that the 400 K outflowing gas fraction probed by the CO is negligible compared to the fraction probed by the H2. For the ambient medium, the measuredratio (triangles) and its dependence on α (non-solid lines) are given for different warm gas content scenarios: when only the mass of the 400 K H2 gas directly seen by Spitzer is used (dashed line) and when the mass of another CO-based 400 K gas component is added. The dashed-dotted line uses an additional mass of 2.5 × 7 M⊙ distributed in clouds of 2 × 106 cm-3 (as in the dashed-dotted CO SLED component in Fig. 11). The dotted line instead uses an additional mass of 2.5 × 8 M⊙ distributed in clouds of 1 × 105 cm-3 (as in the dotted CO SLED component in Fig. 11). This line constrains the upper range of acceptable Mwarm/Mcold values in the ambient medium (solid area).
Current usage metrics show cumulative count of Article Views (full-text article views including HTML views, PDF and ePub downloads, according to the available data) and Abstracts Views on Vision4Press platform.
Data correspond to usage on the plateform after 2015. The current usage metrics is available 48-96 hours after online publication and is updated daily on week days.
Initial download of the metrics may take a while.