Fig. 1
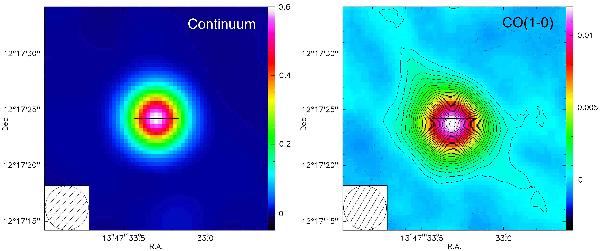
Left: 102 GHz continuum image of 4C12.50 (in units of Jy/beam). Right: continuum-free CO(1–0) line intensity map of 4C12.50 averaged over the –500 km s-1 to 500 km s-1 range, showing extended emission that is offset from the continuum peak (marked with a cross). The contours are at the 3σ levels for this image, i.e., in steps of 0.36 mJy/beam.
Current usage metrics show cumulative count of Article Views (full-text article views including HTML views, PDF and ePub downloads, according to the available data) and Abstracts Views on Vision4Press platform.
Data correspond to usage on the plateform after 2015. The current usage metrics is available 48-96 hours after online publication and is updated daily on week days.
Initial download of the metrics may take a while.