Fig. 5
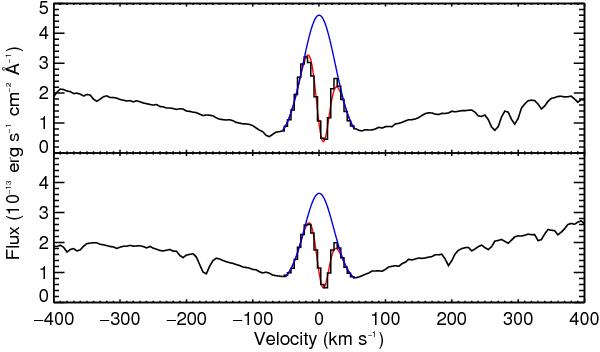
Mg ii stellar absorption line profile of HD 209458 at 2796.3518 Å (Mg ii-k line; top panel) and 2803.5305 Å (Mg ii-h line; bottom panel). The blue line shows the theoretical self-reversed emission profile as seen by ionized magnesium atoms around the planet. The red line shows the line core profile after absorption by the interstellar Mg+, to be compared with the observations (black histogram). Outside of the line core, observations (black line) can be used directly to calculate radiation pressure.
Current usage metrics show cumulative count of Article Views (full-text article views including HTML views, PDF and ePub downloads, according to the available data) and Abstracts Views on Vision4Press platform.
Data correspond to usage on the plateform after 2015. The current usage metrics is available 48-96 hours after online publication and is updated daily on week days.
Initial download of the metrics may take a while.