Fig. 24
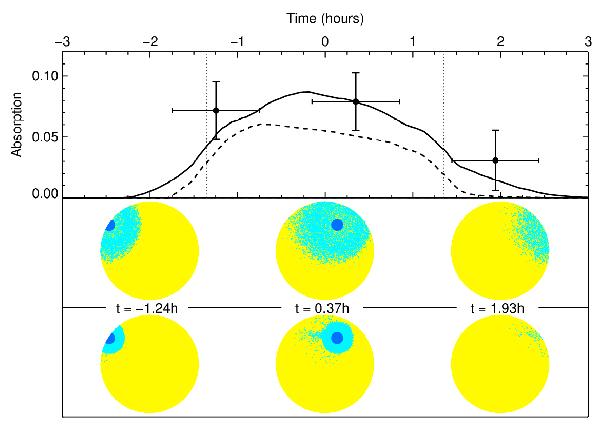
Top panel: theoretical transit absorption depth over the range −60 to 0 km s-1 in the Mg i line (solid and dashed lines). Measurements for the transit-ingress, transit-center, and post-transit observations (Vidal-Madjar et al. 2013) are plotted as black dots with horizontal error bars showing their duration. Vertical dotted lines show the beginning and end of ingress and egress of the planetary transit. The theoretical absorption depth, determined by the stellar surface occulted by the magnesium cloud and its opacity, is displayed for the global best-fit simulation (solid line; Rexo = 3 Rp, vpl − wind = 25 km s-1, ṀMg = 2.9 × 10⁷ g s-1) and the constrained best-fit simulation (dashed line; Rexo = 2 Rp, vpl − wind = 10 km s-1, ṀMg = 6.3 × 10⁷ g s-1). Lower panels: views of the magnesium particles with velocities in the range −60 to 0 km s-1 along the star/Earth line of sight (light blue). HD 209458b is displayed as a deep blue disk. Although the cloud occults a larger area in the global best-fit simulation (middle panel), it is optically thinner than in the constrained best-fit simulation (bottom panel).
Current usage metrics show cumulative count of Article Views (full-text article views including HTML views, PDF and ePub downloads, according to the available data) and Abstracts Views on Vision4Press platform.
Data correspond to usage on the plateform after 2015. The current usage metrics is available 48-96 hours after online publication and is updated daily on week days.
Initial download of the metrics may take a while.