Fig. 23
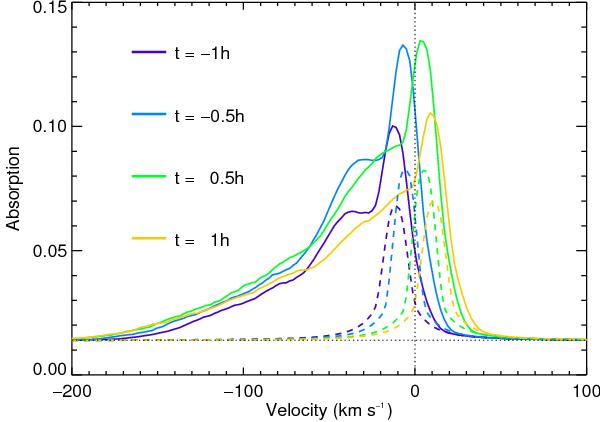
Evolution of the theoretical absorption profile as a function of time during the transit of HD 209458b, for the best-fit simulation of the G-scenario. Absorption in the blue side is generated by radiation-pressure accelerated magnesium atoms and always drops at about −60 km s-1 (at mid-height). The central absorption peak comes from atoms close to the planet (dotted lines show the part of the absorption profile generated by the main atmosphere) and shifts redward of the line with the orbital motion. This is similar to the spectral extension of the observed absorption signature toward positive velocities during and after the transit (Fig. 1). The simulated planetary disk is the source for an absorption depth of ~1.4% at all wavelengths during the transit.
Current usage metrics show cumulative count of Article Views (full-text article views including HTML views, PDF and ePub downloads, according to the available data) and Abstracts Views on Vision4Press platform.
Data correspond to usage on the plateform after 2015. The current usage metrics is available 48-96 hours after online publication and is updated daily on week days.
Initial download of the metrics may take a while.