Fig. 22
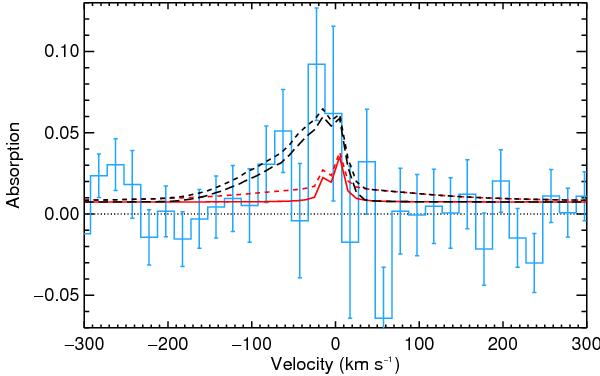
Absorption profile observed in the Mg i line (blue histogram). Two absorption profiles are calculated for best-fit parameters (G-scenario) and a main atmosphere temperature of 5000 K (dashed black line) and 7000 K (solid black line). In both cases, the red line shows the part of the absorption profile generated by neutral magnesium in the main atmosphere. The decrease in temperature leads to higher densities in the main atmosphere, which increases absorption in the wings of the line through natural broadening.
Current usage metrics show cumulative count of Article Views (full-text article views including HTML views, PDF and ePub downloads, according to the available data) and Abstracts Views on Vision4Press platform.
Data correspond to usage on the plateform after 2015. The current usage metrics is available 48-96 hours after online publication and is updated daily on week days.
Initial download of the metrics may take a while.