Fig. 21
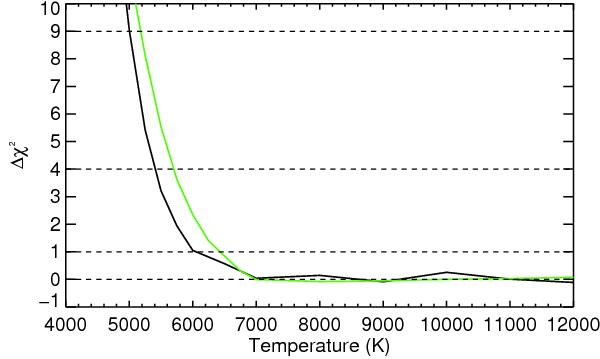
Plot of the χ2 difference between simulations obtained with the best-fit parameters of the G-scenario (black line) or the C-scenario (green line) as a function of the main atmosphere temperature. Horizontal dotted black lines are plotted at 1, 2, and 3σ from each best fit ( ;
;  ), and in both cases the χ2 difference exceeds 1σ with temperatures below ~6100 K.
Current usage metrics show cumulative count of Article Views (full-text article views including HTML views, PDF and ePub downloads, according to the available data) and Abstracts Views on Vision4Press platform.
Data correspond to usage on the plateform after 2015. The current usage metrics is available 48-96 hours after online publication and is updated daily on week days.
Initial download of the metrics may take a while.