Fig. 11
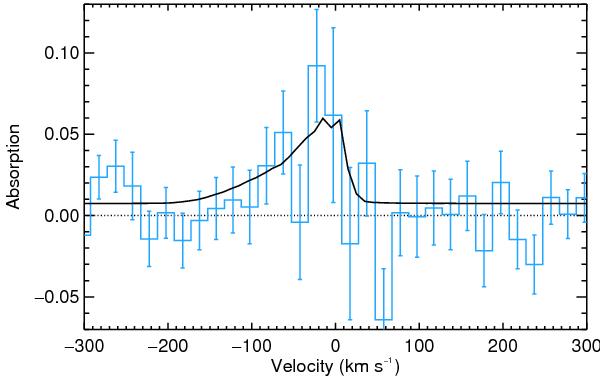
Absorption profiles in the Mg i line calculated with the fluxes averaged over transit and post-transit observations of HD 209458b. The observed profile (Vidal-Madjar et al. 2013) is displayed as a blue histogram with a resolution of 20 km s-1, while the solid black line corresponds to the theoretical global best-fit profile. The  associated with this absorption profile is 225.9 (357 data points), and the χ2 for all observations is 802.4 for 1067 degrees of freedom.
Current usage metrics show cumulative count of Article Views (full-text article views including HTML views, PDF and ePub downloads, according to the available data) and Abstracts Views on Vision4Press platform.
Data correspond to usage on the plateform after 2015. The current usage metrics is available 48-96 hours after online publication and is updated daily on week days.
Initial download of the metrics may take a while.