Free Access
Fig. 1
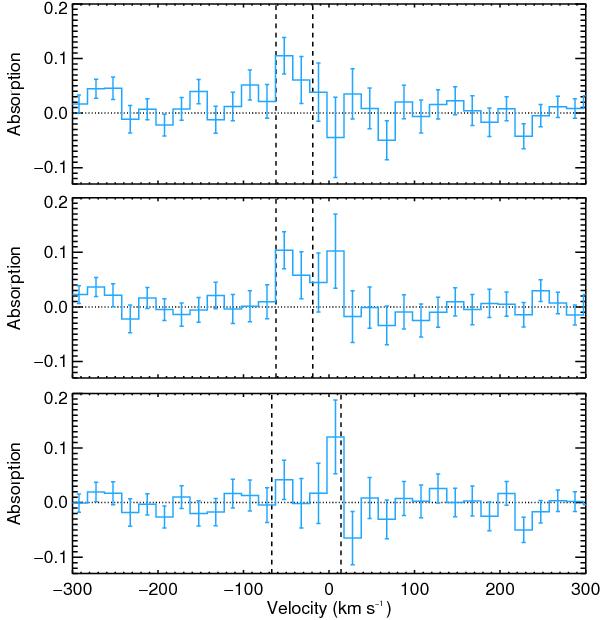
Mg i line absorption profiles during the transit-ingress (top panel), transit-center (middle panel), and post-transit (lower panel) observations of HD 209458b. The resolution is 20 km s-1. The absorption signatures detected by Vidal-Madjar et al. (2013) are delimited by vertical dashed black lines.
This figure is made of several images, please see below:
Current usage metrics show cumulative count of Article Views (full-text article views including HTML views, PDF and ePub downloads, according to the available data) and Abstracts Views on Vision4Press platform.
Data correspond to usage on the plateform after 2015. The current usage metrics is available 48-96 hours after online publication and is updated daily on week days.
Initial download of the metrics may take a while.