Free Access
Fig. 20
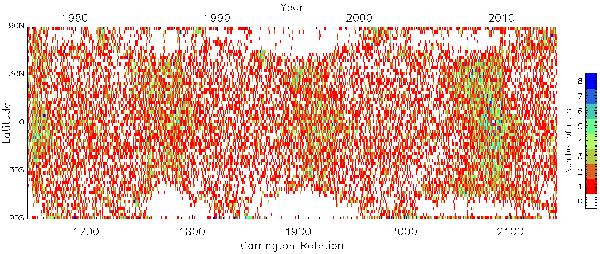
“Butterfly” plot of the number of nulls present at each latitude against time. The colour represents the number of nulls in a particular latitudinal range for each synoptic map. The y axis is scaled with the sine of the latitude so that every pixel represents the same area on the sun.
Current usage metrics show cumulative count of Article Views (full-text article views including HTML views, PDF and ePub downloads, according to the available data) and Abstracts Views on Vision4Press platform.
Data correspond to usage on the plateform after 2015. The current usage metrics is available 48-96 hours after online publication and is updated daily on week days.
Initial download of the metrics may take a while.