Free Access
Fig. 18
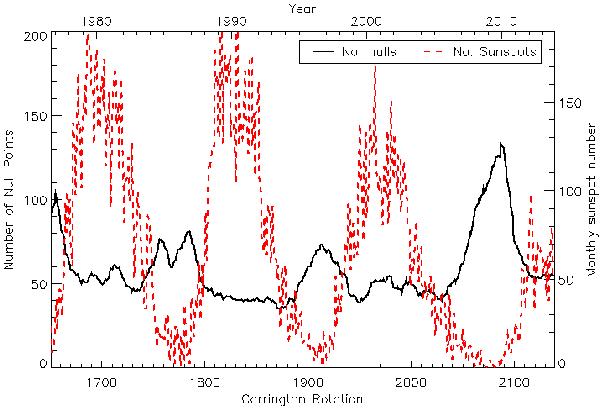
Variation in the number of nulls over time. The solid line shows a 12 CR running mean of the number of null points and the dashed red line shows the monthly sunspot number.
Current usage metrics show cumulative count of Article Views (full-text article views including HTML views, PDF and ePub downloads, according to the available data) and Abstracts Views on Vision4Press platform.
Data correspond to usage on the plateform after 2015. The current usage metrics is available 48-96 hours after online publication and is updated daily on week days.
Initial download of the metrics may take a while.