Fig. A.1
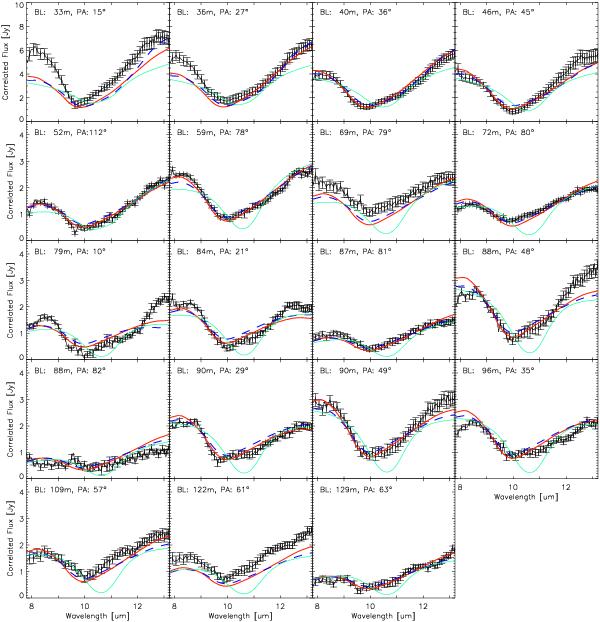
Correlated fluxes of observations taken with UTs. The red and dashed blue lines are the curves obtained with our first and second best-fit models. The light blue curve shows the correlated fluxes of our best-fit model found using SiC as the dust template for all the components. We observe that the main reason of discarding SiC as the best option is mostly due to the shape of the absorption feature.
Current usage metrics show cumulative count of Article Views (full-text article views including HTML views, PDF and ePub downloads, according to the available data) and Abstracts Views on Vision4Press platform.
Data correspond to usage on the plateform after 2015. The current usage metrics is available 48-96 hours after online publication and is updated daily on week days.
Initial download of the metrics may take a while.