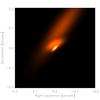
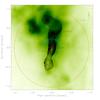
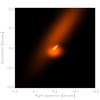
Fig. 7
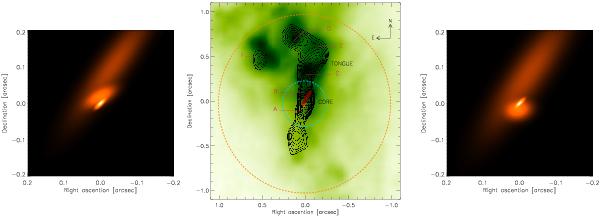
Images of the three component models for the mid-infrared emission at 12.0 μm of the nuclear region of NGC 1068 corresponding to model 1 (left) and model 2 (right). The image was scaled using the square root of the brightness. Center: comparison between our first best model and the 12.5 μm image of Bock et al. (2000), taken with the 10 m Keck Telescope. The dashed circles represent the FWHM of the field of view for MIDI using the UTs (blue) or the ATs (orange). The letters indicate the positions of the [OIII] clouds according to Evans et al. (1991).
Current usage metrics show cumulative count of Article Views (full-text article views including HTML views, PDF and ePub downloads, according to the available data) and Abstracts Views on Vision4Press platform.
Data correspond to usage on the plateform after 2015. The current usage metrics is available 48-96 hours after online publication and is updated daily on week days.
Initial download of the metrics may take a while.