Fig. 6
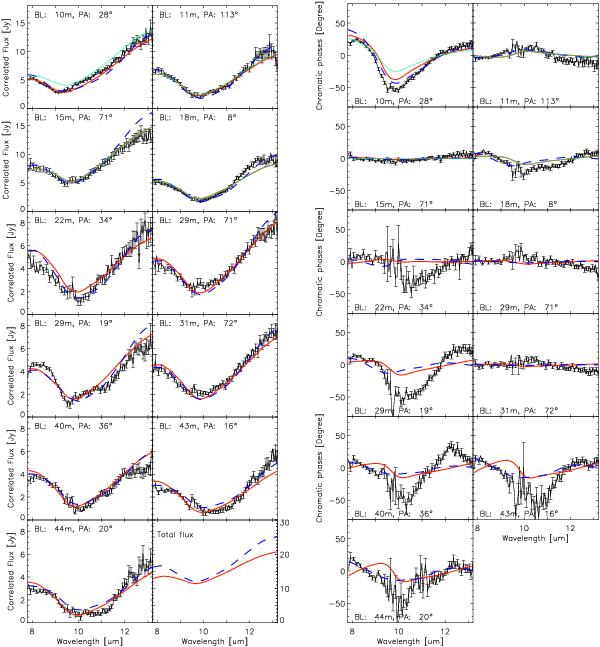
Best-fit model for the (u,v) points observed with the ATs. Left: correlated fluxes and right: chromatic phases. The red line shows the corresponding correlated fluxes and chromatic phases for our non-concentric model no. 1 while the dashed blue line represents our non-concentric model no. 2. Light green lines (only on the first four plots of each panel) show the curves obtained by taking the parameters of our first-best model, and taking the lower limit of the uncertainty in the offset declination for the third component, we observe some significant deviations in some of the plots.
Current usage metrics show cumulative count of Article Views (full-text article views including HTML views, PDF and ePub downloads, according to the available data) and Abstracts Views on Vision4Press platform.
Data correspond to usage on the plateform after 2015. The current usage metrics is available 48-96 hours after online publication and is updated daily on week days.
Initial download of the metrics may take a while.