Fig. 5
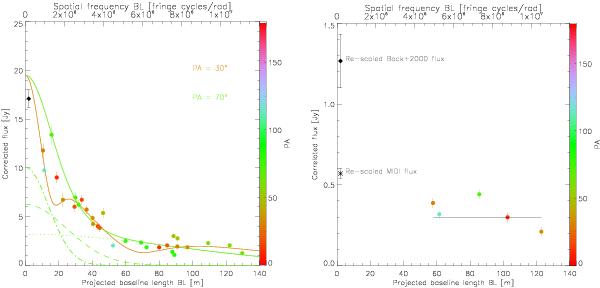
Correlated fluxes of NGC 1068 at
λ = 12.5
μm as a function of the projected baseline
length BL. Left: the data are colored according to their respective
position angles. The solid lines represent the correlated fluxes obtained at two
different position angles from the Gaussian modeling (model 1). The contribution of
each component is represented by different lines: the dotted line represents the
first component, the dashed line is the second component, and the dash-dotted line
the third component for a PA = 70°. Right: expected radial plot
using the photometry from Bock et al. (2000)
for NGC 1068 if the source is placed at a
distance  times farther away than its current position.
Current usage metrics show cumulative count of Article Views (full-text article views including HTML views, PDF and ePub downloads, according to the available data) and Abstracts Views on Vision4Press platform.
Data correspond to usage on the plateform after 2015. The current usage metrics is available 48-96 hours after online publication and is updated daily on week days.
Initial download of the metrics may take a while.