Fig. 4
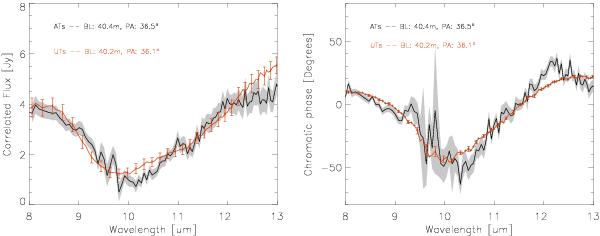
Comparison of the correlated flux observed with a projected baseline of 40 m and PA = 36° using UTs (observed in 2005, Raban et al. 2009) and using ATs (observed in 2012). The red line with error bars represents the correlated flux obtained with the UTs. The black line with a gray shaded region represents the correlated flux obtained with ATs.
Current usage metrics show cumulative count of Article Views (full-text article views including HTML views, PDF and ePub downloads, according to the available data) and Abstracts Views on Vision4Press platform.
Data correspond to usage on the plateform after 2015. The current usage metrics is available 48-96 hours after online publication and is updated daily on week days.
Initial download of the metrics may take a while.