Fig. 3
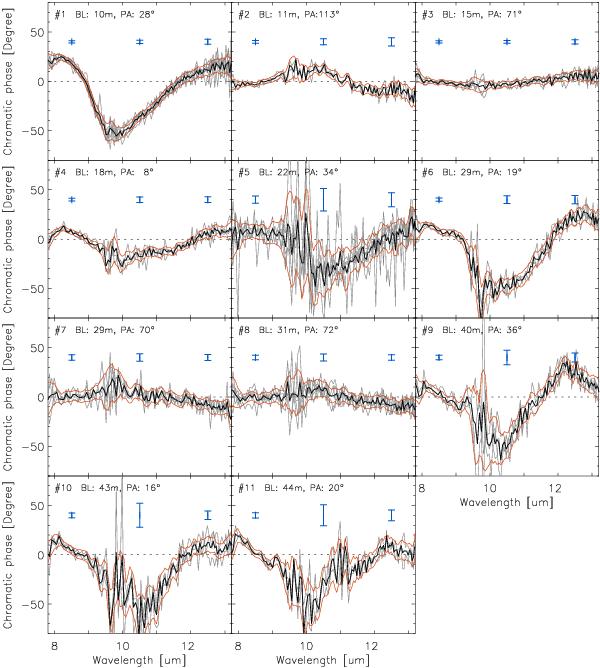
Chromatic phases grouped by their separation in the (u,v) plane. The chromatic phases of each independent observation in the group are given in gray lines and the average computed signal is shown with a black line. The red lines represent the region of the 1-sigma uncertainty of a single observation. Blue bars represent the 2-sigma uncertainty of the average chromatic phase at 8.5, 10.5, and 12.5 μm.
Current usage metrics show cumulative count of Article Views (full-text article views including HTML views, PDF and ePub downloads, according to the available data) and Abstracts Views on Vision4Press platform.
Data correspond to usage on the plateform after 2015. The current usage metrics is available 48-96 hours after online publication and is updated daily on week days.
Initial download of the metrics may take a while.