Fig. 2
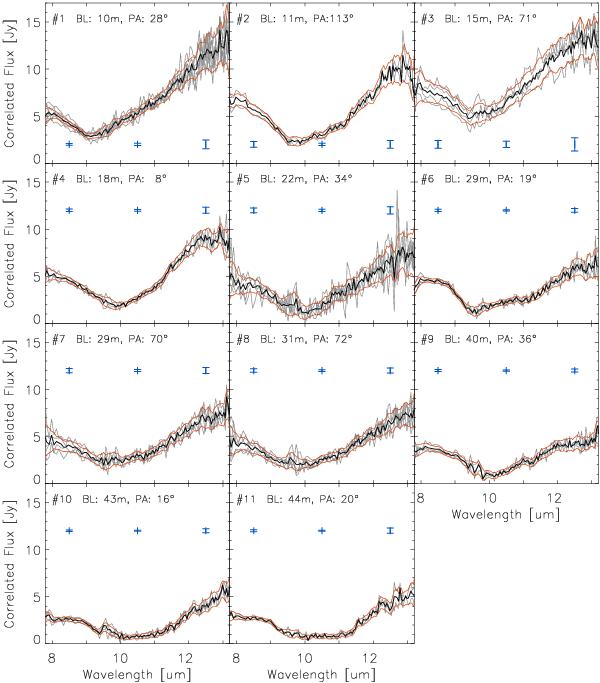
Amplitudes of correlated fluxes measured with ATs and grouped by their separation in the (u,v) plane (see text for the selection criterion). The group numbers are given in the top left corner. The different correlated fluxes are displayed in gray lines and the average computed spectrum is shown with a black line. The red lines represent the region of the 1-sigma uncertainty of a single observation. Blue bars represent the 2-sigma uncertainty of the average computed spectrum at 8.5, 10.5, and 12.5 μm. The region between 9 μm and 10 μm has higher uncertainty because of the atmospheric O3 absorption feature in this region.
Current usage metrics show cumulative count of Article Views (full-text article views including HTML views, PDF and ePub downloads, according to the available data) and Abstracts Views on Vision4Press platform.
Data correspond to usage on the plateform after 2015. The current usage metrics is available 48-96 hours after online publication and is updated daily on week days.
Initial download of the metrics may take a while.