Fig. 1
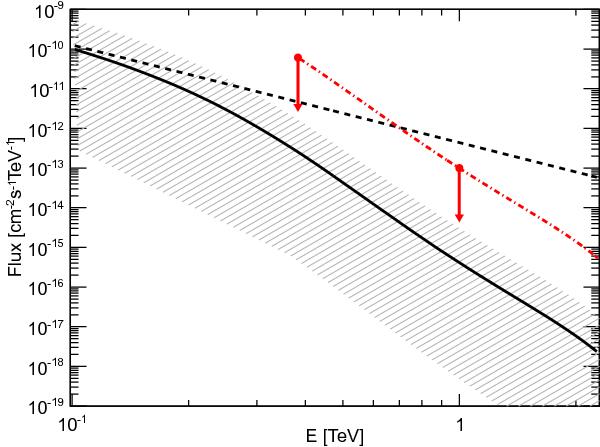
Solid line: spectral-temporal model matching the H.E.S.S. observation window, dashed line: same spectrum without applying the EBL model by Franceschini et al. (2008). It can be seen that the spectral shape is dominated by the EBL absorption in the H.E.S.S. energy range. The red dashed-dotted line shows the spectrum that corresponds to the limits given in Table 2 as obtained by the analysis of the total data set, where the red dots are the two given differential representations. The shaded area shows the effect of varying the Konus-WIND high-energy photon index β within its one-sigma error.
Current usage metrics show cumulative count of Article Views (full-text article views including HTML views, PDF and ePub downloads, according to the available data) and Abstracts Views on Vision4Press platform.
Data correspond to usage on the plateform after 2015. The current usage metrics is available 48-96 hours after online publication and is updated daily on week days.
Initial download of the metrics may take a while.