Fig. 5
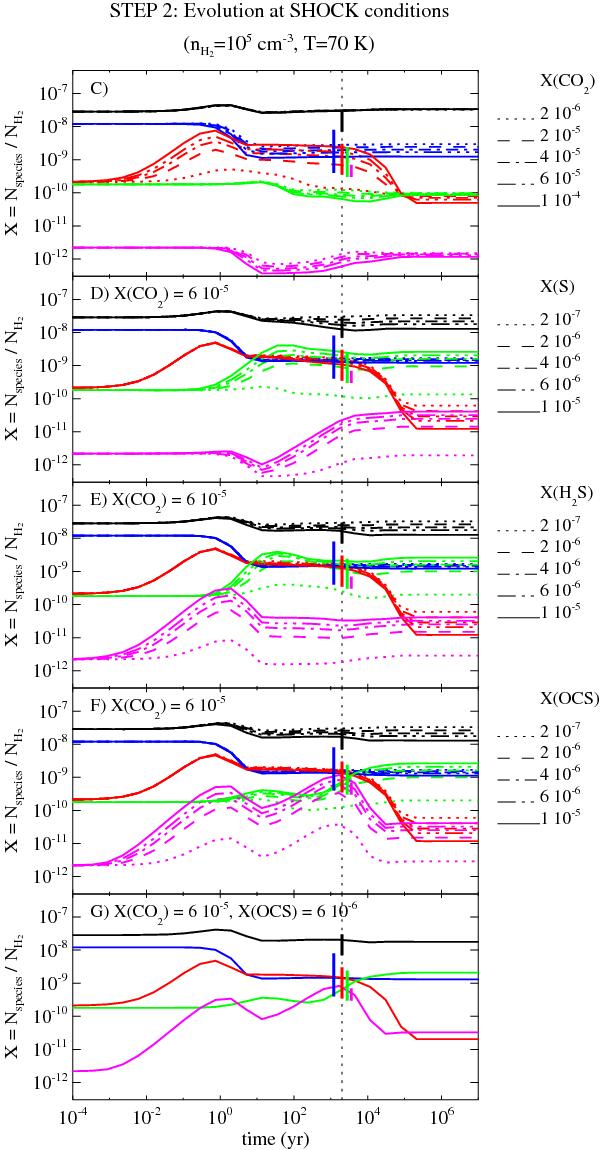
Evolution of molecular ions abundances in the shock as a function of time (“STEP 2”). The colours indicate HCO+ (black), N2H+(blue), HOCO+ (red), SO+ (green), and HCS+ (magenta) abundances. Observed abundances (colour vertical bars) are overplotted at the shock age (tshock ~ 2000 years, vertical dotted line). The evolution is computed from steady-state values in the cloud (nH2= 104 cm-3, Tkin = 10 K, ζ = 3 × 10-16 s-1) by enhancing the gas temperature and density (nH2= 105 cm-3, Tkin = 70 K), and the abundance of molecules which are thought to be sputtered off dust grain mantles: CO2, S, H2S, and OCS (panels C), D), E), and F), respectively). When varying S, H2S, and OCS abundances, XCO2 is set to = 6 × 10⁻⁵. Finally, panel G) shows the evolution of molecular ions abundances in our “best-fit model”, i.e. for XCO2= 6 × 10⁻⁵ and XOCS= 6 × 10⁻⁶.
Current usage metrics show cumulative count of Article Views (full-text article views including HTML views, PDF and ePub downloads, according to the available data) and Abstracts Views on Vision4Press platform.
Data correspond to usage on the plateform after 2015. The current usage metrics is available 48-96 hours after online publication and is updated daily on week days.
Initial download of the metrics may take a while.