Fig. 4
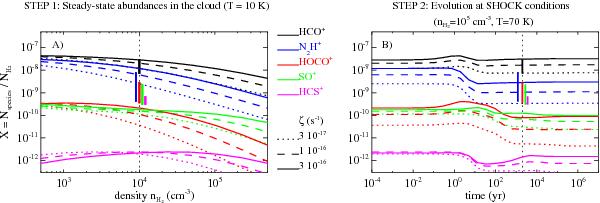
Observed abundances of molecular ions (colour vertical bars) are compared with theoretical values calculated with Astrochem (colour lines). The colours indicate HCO+ (black), N2H+(blue), HOCO+ (red), SO+ (green), and HCS+ (magenta) abundances. PanelA) “STEP 1”: steady-state abundances in the cloud, X = Nspecies/NH2, as a function of the gas density, nH2 (cm-3), for gas temperature Tkin = 10 K, and cosmic ray ionisation rate ζ = 3 × 10-17,10-16,3 × 10⁻¹⁶ s-1 (dotted, dashed, and solid lines). Observed abundances are overplotted at the assumed cloud density (nH2= 104 cm-3, vertical dotted line). PanelB) “STEP 2”: evolution of steady-state abundances in the shock as a function of time (in years). The gas density and temperature are raised from cloud values (nH2= 104 cm-3, Tkin = 10 K) to the observed values in the outflow cavity (nH2= 105 cm-3, Tkin = 70 K). Observed abundances are overplotted at the shock age (tshock ~ 2000 years, vertical dotted line).
Current usage metrics show cumulative count of Article Views (full-text article views including HTML views, PDF and ePub downloads, according to the available data) and Abstracts Views on Vision4Press platform.
Data correspond to usage on the plateform after 2015. The current usage metrics is available 48-96 hours after online publication and is updated daily on week days.
Initial download of the metrics may take a while.