Fig. 3
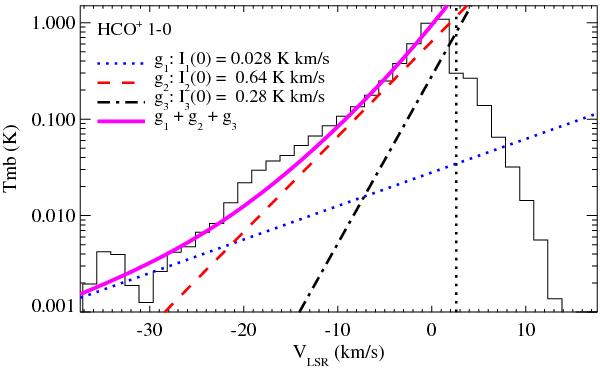
Profile of the HCO+ 1–0 line observed in the L1157-B1 shock. The line intensity is in mean beam temperature (Tmb) and the systemic velocity (VLSR = + 2.6 km s-1) is indicated by the vertical dotted lines. The line profile is fitted by a linear combination of three exponential functions g1 = I1(0) exp(−|V/12.5 km s-1|) (blue dotted line), g2 = I2(0) exp(−|V/4.4 km s-1|) (red dashed line), and g3 = I3(0) exp(−|V/2.5 km s-1)| (dotted-dashed black line). The (g1 + g2 + g3) line fit is overplotted (magenta solid line).
Current usage metrics show cumulative count of Article Views (full-text article views including HTML views, PDF and ePub downloads, according to the available data) and Abstracts Views on Vision4Press platform.
Data correspond to usage on the plateform after 2015. The current usage metrics is available 48-96 hours after online publication and is updated daily on week days.
Initial download of the metrics may take a while.