Fig. 7
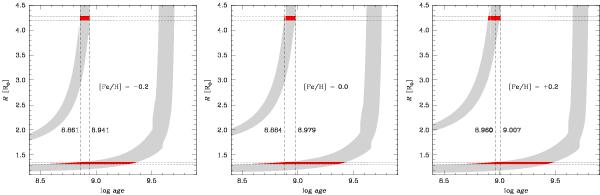
Evolution of the radius of the system components in the mass range M1,2 ± 2σ(M1,2) (shaded regions, from Table 2) for three values of chemical composition. The darker regions represent the intersection with R1,2 ± 2σ(R1,2) (horizontal lines, also from Table 2). The vertical lines indicate the limits in age according to the constraint of coevality of the two stars.
Current usage metrics show cumulative count of Article Views (full-text article views including HTML views, PDF and ePub downloads, according to the available data) and Abstracts Views on Vision4Press platform.
Data correspond to usage on the plateform after 2015. The current usage metrics is available 48-96 hours after online publication and is updated daily on week days.
Initial download of the metrics may take a while.