Fig. 6
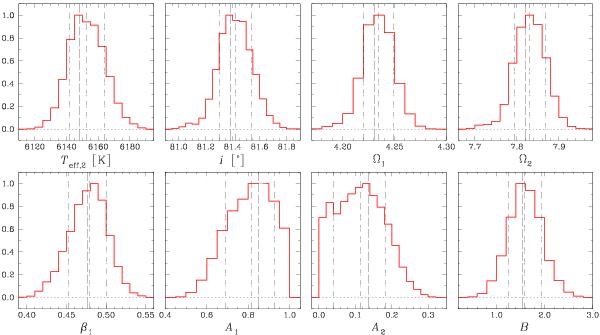
Distributions of the parameters resulted from our Markov chain Monte Carlo (MCMC) simulations. The histograms are normalized to unit and contain 40 000 accepted solutions each. The median of each distribution and the limits enclosing 68% of the results (with equal probability in both sides) are indicated by the dashed lines, and represent the values listed in Table 2. The solid lines indicate the solution that minimizes χ2.
Current usage metrics show cumulative count of Article Views (full-text article views including HTML views, PDF and ePub downloads, according to the available data) and Abstracts Views on Vision4Press platform.
Data correspond to usage on the plateform after 2015. The current usage metrics is available 48-96 hours after online publication and is updated daily on week days.
Initial download of the metrics may take a while.