Fig. 2
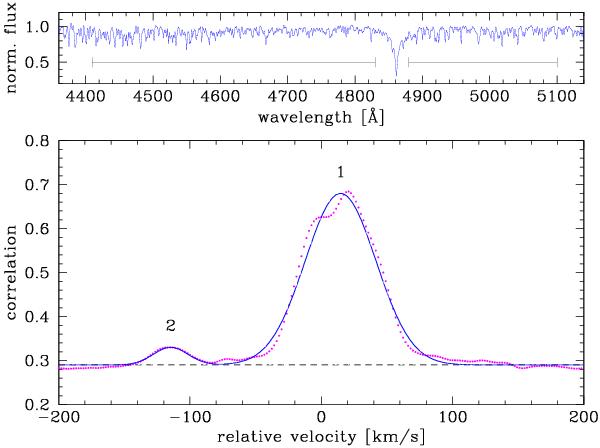
Example of cross-correlation used to derive the radial velocities of the CoRoT 105906206 components. Top panel: a portion of FEROS spectra showing the regions used (delimited by horizontal bars). Bottom panel: cross-correlation peaks of the primary (1) and secondary (2) stars (dots) fitted by a double-Gaussian function (solid line).
Current usage metrics show cumulative count of Article Views (full-text article views including HTML views, PDF and ePub downloads, according to the available data) and Abstracts Views on Vision4Press platform.
Data correspond to usage on the plateform after 2015. The current usage metrics is available 48-96 hours after online publication and is updated daily on week days.
Initial download of the metrics may take a while.