Fig. 6
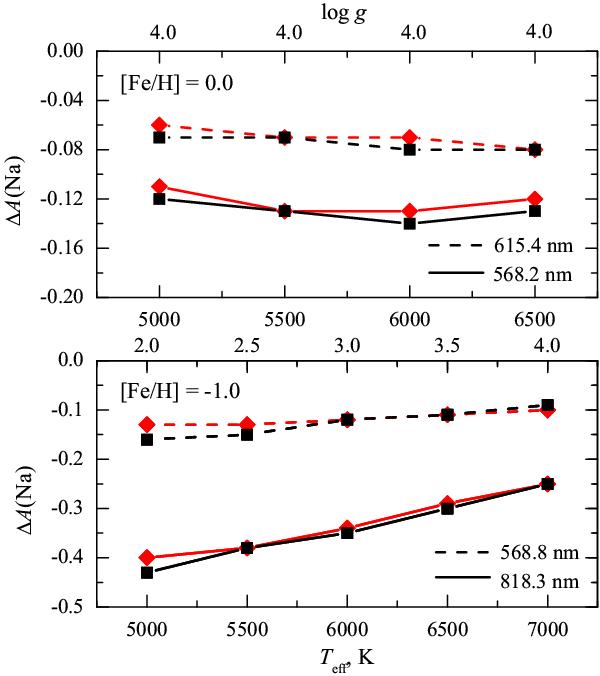
1D NLTE abundance corrections for different spectral lines of sodium, as obtained in this work (black lines and symbols) and by Lind et al. (2011, red lines and symbols). Top panel: abundance corrections for the spectral lines located at λ = 568.2 nm (solid lines) and λ = 615.4 nm (dashed lines). Bottom panel: abundance corrections for the spectral lines located at λ = 568.8 nm (dashed lines) and λ = 818.3 nm (solid lines).
Current usage metrics show cumulative count of Article Views (full-text article views including HTML views, PDF and ePub downloads, according to the available data) and Abstracts Views on Vision4Press platform.
Data correspond to usage on the plateform after 2015. The current usage metrics is available 48-96 hours after online publication and is updated daily on week days.
Initial download of the metrics may take a while.