Fig. 3
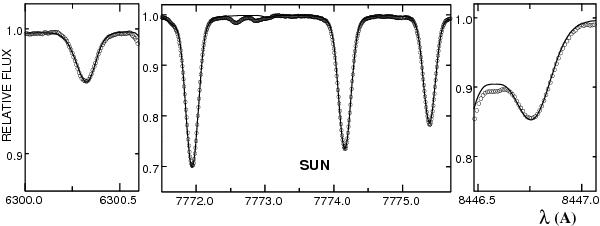
Synthetic NLTE spectral lines of oxygen (solid lines) compared with the observed solar spectrum (dots) from Kurucz et al. (1984). Left: forbidden line at 630.0 nm, Centre: infrared triplet at 777 nm, Right: infrared line at 845 nm. All synthetic spectral line profiles were computed using solar oxygen abundance of A(O) = 8.71.
Current usage metrics show cumulative count of Article Views (full-text article views including HTML views, PDF and ePub downloads, according to the available data) and Abstracts Views on Vision4Press platform.
Data correspond to usage on the plateform after 2015. The current usage metrics is available 48-96 hours after online publication and is updated daily on week days.
Initial download of the metrics may take a while.