Fig. 2
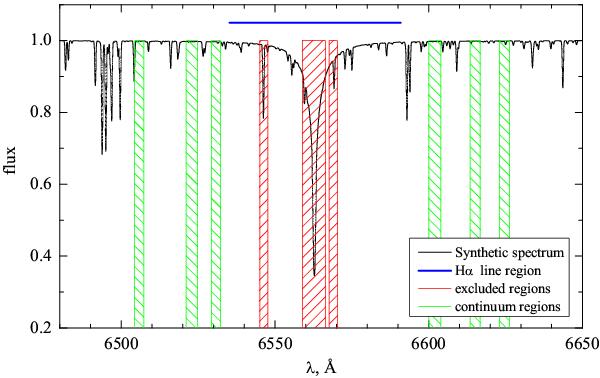
Synthetic spectrum of a TO star in 47 Tuc (00006129, Teff = 5851 K, log g = 4.06) showing Hα line region used for the effective temperature determination. Blue bar above the synthetic spectrum indicates the range were fitting of the Hα line wings was done, red dashed rectangles mark the regions excluded from the fitting procedure, while green dashed rectangles highlight the spectral regions used to determine continuum level.
Current usage metrics show cumulative count of Article Views (full-text article views including HTML views, PDF and ePub downloads, according to the available data) and Abstracts Views on Vision4Press platform.
Data correspond to usage on the plateform after 2015. The current usage metrics is available 48-96 hours after online publication and is updated daily on week days.
Initial download of the metrics may take a while.