Fig. 8
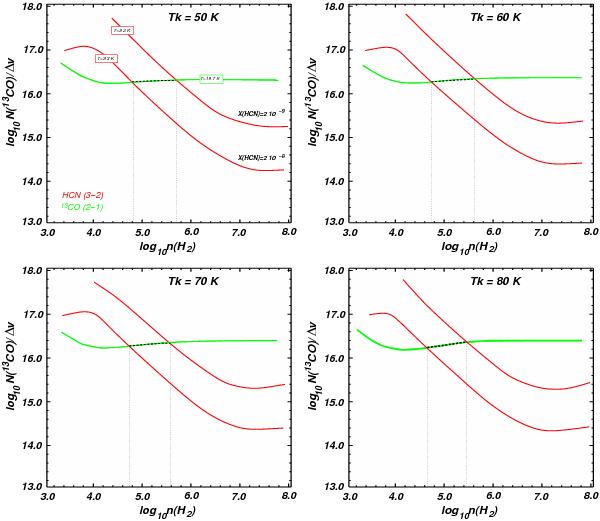
LVG models for 13CO and HCN peak temperatures as a function of normalized column density and volume density. We adopted abundances [13CO]/[H2] = 2 × 10⁻⁶ and [HCN]/[H2] = (2–20) × 10-8. The green lines trace the contours of 13CO peak intensity, while the red lines trace the contours of HCN peak intensity. Dotted black lines are where solutions are coincident.
Current usage metrics show cumulative count of Article Views (full-text article views including HTML views, PDF and ePub downloads, according to the available data) and Abstracts Views on Vision4Press platform.
Data correspond to usage on the plateform after 2015. The current usage metrics is available 48-96 hours after online publication and is updated daily on week days.
Initial download of the metrics may take a while.